|
|
|
|
Data Analysis I
After completing the data collection stage of the process, the group next began the task of analyzing all the information. In doing so, we looked at some basic questions that needed to be answered as well as any inconsistencies that were present within the data to try and come up with some tangible results. Highlighting the major findings from each, this section will walk through the most important questions raised by our data. Those questions are:
Which body part is affected most by the injuries?
When we first visited the woodchuck facilities, the site manager had asked for our help because of the large increase in back injuries that were occurring among workers over the past few years. Thus, we started out analyzing the data based on general types of injuries as well as trends of these injuries over the past five years. The data confirmed the site manager's concern about back troubles. When looking at all injury reports based on body location, 14% were a result of problems with the upper or lower back. Yet, the data also addressed concerns about other body locations. These included finger and hand injuries which consisted of 36% of all the injuries as well as elbow injuries making up another 12% of the total.
Because the site manager was concerned with cumulative injury types, we further broke down the injury data and analyzed only the "soft" injuries. "Soft" injuries included the strains, sprains, and pains that would be typically responsible for the cumulative injury problems. This helped clarify the site manager's concerns. We found that 28% of the soft injuries dealt with the upper and lower back, 18% with wrist, 13% with elbow, and 11% with knee. For further details, see graphs to the right. |
Injuries by Body Location
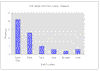
Soft Injuries by Location
|
What types of injuries were they?
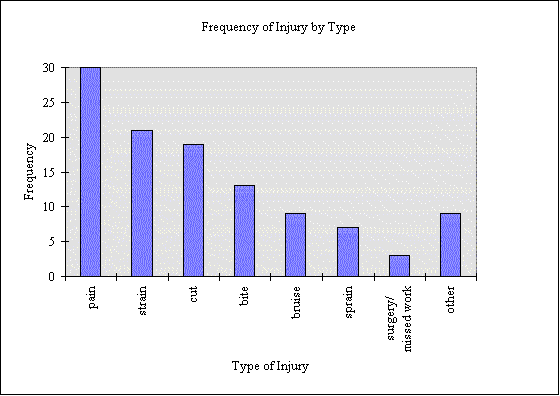
Next we analyzed frequency of injury by type. Here we found that pain was the highest reported injury type making up 27% of the total. Strains made up another 19% of the total, cuts 17%, bites 12%, bruises 8%, and sprains 6%. This strengthened the prior finding on soft injuries, since pains, strains and sprains made up more then half of the reported injury types from this data.
|
Injuries by Type: |

Injuries by Activity
|
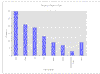
What types of activities caused these injuries?
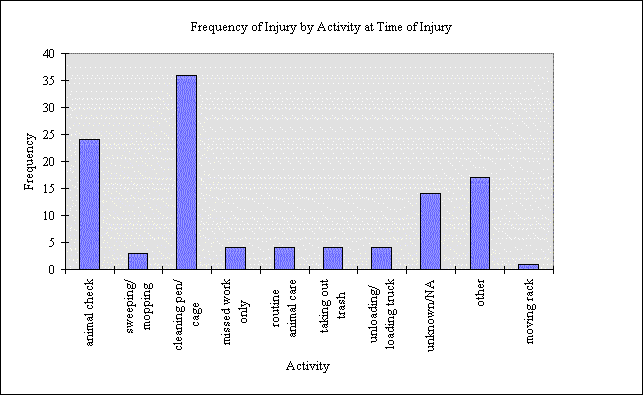
We also wanted to get a better understanding of whether or not there were specific activities causing these injuries. In analyzing frequency of injury by activity, we found that of the known location of injuries, 42% of them occurred while employees were cleaning the cages or pens and that another 12% occurred when employees were checking the rabbits and woodchucks. See graph to the left. |
Injuries by Locale
|
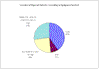
Where did these injuries occur?
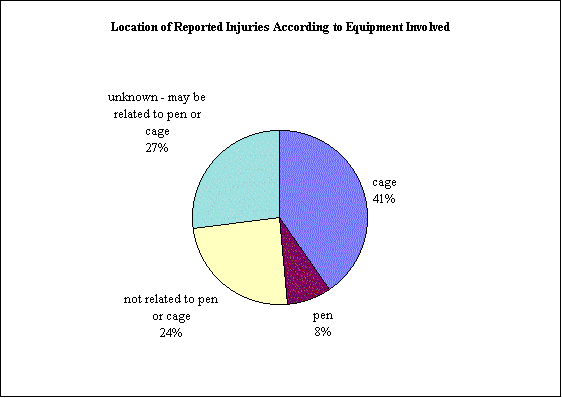
And finally we looked at the location of these injuries within the woodchuck facilities. Not surprisingly, of the known locale of injuries, 57% of them occurred within cages, 11% within pens and only the remaining 33% were injuries that occurred in places other then these. See pie chart.
|
|
Previous page:
RULA |
Next page:
Data Analysis II |
|