
Air Quality Investigation
Excerpted from a 1996 paper by
Kathryn Laeser & Dena
Tepper
During the past few years, staff at two Ithaca middle schools had expressed increasing concern about the air quality at their school. A number of investigations have been conducted. Some of the conditions observed during these investigations included: missing filters in air handling units, debris deposited within cooling and heating chambers, water pooling in bottom pan of cooling chamber, and pools of stagnant water near air intake sources. Surveys were completed by staff in November of 1992 and in June of 1993. The results of these surveys were not interpreted in a comprehensive manner.
Both schools were designed and built in the 1970's as open classroom schools. The HVAC system was originally designed to accommodate this open plan design. Since then, temporary walls have been erected dividing the space into individual classrooms. As a result, there are now interior classrooms with no windows. Attempts were made to adjust the HVAC system to correspond with these design changes.
In the spring of 1994 the environmental specialist for the Ithaca School District, contacted Dr. Alan Hedge, a professor in the Department of Design and Environmental Analysis at Cornell University, asking for assistance in diagnosing potential air quality problems at the two Ithaca middle schools. Dr. Hedge agreed, and assembled a team of four graduate students to undertake an air quality investigation.
The first step of the investigation was to visit the middle schools,
where Dr. Hedge and his team had an opportunity to speak with staff and
listen to their complaints. Occupant complaints fell into two categories:
Complaints of symptoms such as congested nose, and irritated eyes; and perceptions
of building conditions. Many of the complaints about building conditions
indicated thermal discomfort; that is, their rooms felt too hot or too cold.
Next, the group conducted a walkthrough of the facility. Conditions were
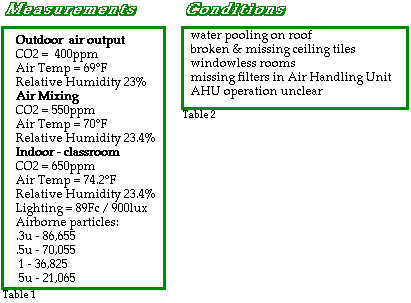
observed, noted, and preliminary measurements taken. Tables 1 and 2 summarize
results of the initial walkthrough. It is important to note that at the
time of the initial walkthrough the HVAC system was in the process of being
balanced and repaired which may account for the missing filters.

A survey was used in the investigation of DeWitt Middle School to collect more information about occupant complaints and develop a hypothesis that could explain the problem. Our goal was to collect data that would help us define the complaint area, look for timing patterns, and look for spatial patterns, before moving forward. For example, if the complaint is limited to a single room, it would make sense to evaluate pollutant pathways into that room before attempting to inventory sources in locations outside of, but connected to, the complaint area. An additional purpose of the survey was to establish a baseline from which one can work in order to determine the effects of any mitigation.
A survey tailored for DeWitt Middle School was constructed using the Indoor Air Quality Survey developed by Dr. Alan Hedge as a model.
Teachers were asked to complete a survey for the room that they spent the majority of their time in during the week. If teachers spent a significant amount time (20 hours) in two rooms, they were asked to fill out a survey for each room. In the case that more than one teacher or worker occupied the room, each was asked to complete the survey.
Ninety-eight surveys were distributed, and fifty-eight returned, giving
us a 59% return rate. Surveys returned up to one week after the deadline
were included in the analysis.
Information about the spatial pattern (location) of complaints, and the
timing of symptoms and complaints was used to define the complaint areas
and provide direction for further investigation. Data for environmental
conditions and symptoms were plotted on floor plans of the school to analyze
spatial patterns. This data was then translated into percentage of complaints
corresponding to each HVAC zone (The school was divided into four parts
each served by a separate HVAC system). Percentage of reported complaints
were indicated by zone for each condition, work-related symptoms, and post-balancing
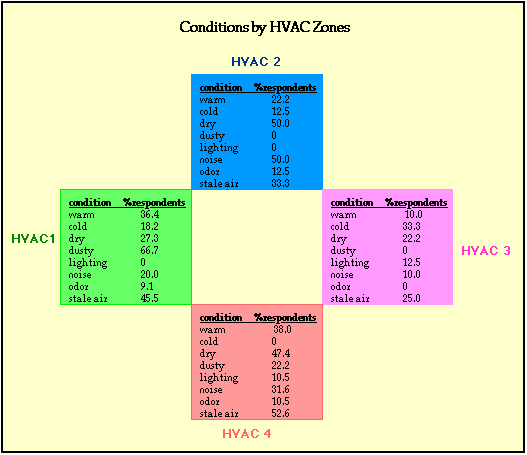
data. The figure bellow is illustrates the percent of respondents which
complained of a particular condition in each of the four HVAC zones. Our
purpose was to identify building locations where symptoms or discomfort
occur the most, in order to assess which rooms or HVAC zones should be given
particular attention during further investigation. Evidence suggested that
indoor rooms and HVAC zone four may be of particular concern. 
The time weighted averages were calculated for conditions and work related
symptoms, and compared across HVAC zones. This calculation represents the
total number of complaints of a particular condition or symptom in an HVAC
zone, weighting each complaint according to the frequency with which it
occurred (daily, weekly, monthly). The value is an average, therefore, canceling
out misleading differences due to varying numbers of occupants in each HVAC
zone. The value can be interpreted as an indication of theprevelence of
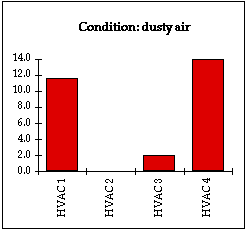
a condition or symptom. The bar graphs give us visual information about
how HVAC zones compare to one another in the prevalence of conditions and
symptoms perceived. The figure below illustrates the data for the condition
"dusty air".

More problems are consistently reported in HVAC 4 than in any other zone. Occupants served by HVAC 2 and HVAC 3 overall are reporting less problems than the other zones.
Discomfort due to thermal conditions (too warm, too cold), is reported throughout the building. HVAC 4 does not seem to have a great problem with the temperature being too cold, but notice the high prevalence of the temperature being too warm in this zone. Rooms serviced by HVAC 4 are located on the southwest side of the building. The prevalence of the condition too warm, coupled with the data showing low frequencies for the condition too cold, may be an indication that these rooms are subject to a significant increase in radiant heat from the afternoon sun.
Air that is too dry also appears to be a common source of discomfort across all parts of the building.
The wide range of differences between zones seen in graphs for odor, dusty air, and noise, may indicate an isolated source affecting a particular zone.
Occupants of HVAC 1, HVAC 3, and HVAC 4, feel equally that the lighting is too bright. Interpretation of Symptoms Perceived
The prevalence of lethargy is consistent throughout all parts of the building.
Occupants reporting sore eyes are concentrated in HVAC 1 and HVAC 4.
Occupants of HVAC 1 are experiencing symptoms of sore eyes, irritated throat, and stuffy nose with greater prevalence than any other part of the building. This may correspond to the fact that there are few work spaces in this zone that have windows.
Occupants of HVAC 4 are experiencing headaches more often than occupants of other zones.
The consistently medium to high reported symptoms in HVAC 4 corresponds with high reported prevalence of conditions reported in this same zone.
Parts of a building are differently affected by sunlight depending on the building orientation. The southwest part of a building is likely to be considerably warmer than other parts. Therefore, it is further expected that the patterns of thermal conditions will be based on occupants' location within the building.
The results indicate that complaints about rooms being either too cold or too warm, i.e., thermal conditions, were very prevalent. We, therefore, hypothesize that building occupants may be mistaking unsatisfactory thermal conditions for air quality problems.
Another possibility is suggested by the United States Environmental Protection Agency (1988) which points out that, "complaints that initially seem to be linked to thermal discomfort, underventilation, or indoor air pollutants may actually be caused or complicated by such factors such as environmental stressors (e.g., lighting , noise, vibration), ergonomic stressors. and job-related psychological (human relations) stressors...Complaints produced by these stressors are sometimes mistakenly blamed on contaminated air". However, such stressors also can produce a heightened sensitivity to poor indoor air quality. Therefore, we have not assumed that they are the only reason for complaints, but that they may be contributing to complaints.
The design of an air sampling strategy should fit the intended use of the measurements. Our use of measurements would be to confirm survey data of perceived environmental conditions with that of actual conditions. The next step in the process then would be to take measurements of, for example, air temperature in areas where occupants are complaining that it is too cold and compare those measurements with those taken in areas where there where no complaints. Likewise measurements can be taken in areas where occupants where complaining that it is too warm and then compare these too to areas with no temperature complaints. The expectation is that measurements of thermal conditions will confirm survey data of reported thermal conditions.
These results, as well as the results of the survey will provide a baseline to which all future measurements and survey data can be compared. In this way the results of any interventions, such as the recent balancing of the HVAC system, can be measured.